Data Visualization
The goal of the Data Visualization group is to inspire and empower our users, Fraud Analysts and Data Scientists, to make accurate and fast decisions, making complex data understandable through insightful, accessible, and beautiful data experiences, while enabling the community to evolve together.
Research Focus:
- Enhance explainability and governance of Machine Learning models
- Complex fraud pattern detection and recognition
- Accessibility in Data Visualization in a business setting
Recent Publications
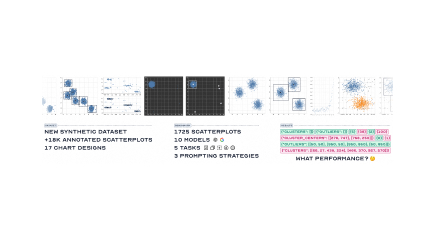


Show Me What’s Wrong!: Combining Charts and Text to Guide Data Analysis
Published at NLVIZ, a workshop at IEEE VIS 2024
Related Blog Posts

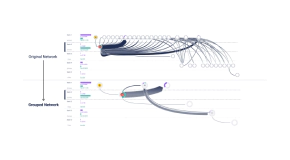
From a Trace to Money Flow: How we built an interactive visualization to uncover money laundering
Money laundering works by staying invisible. Feedzai's Money Flow visualization turns scattered transaction traces into a readable map of who moved money, where, and when.
Salomé Esteves
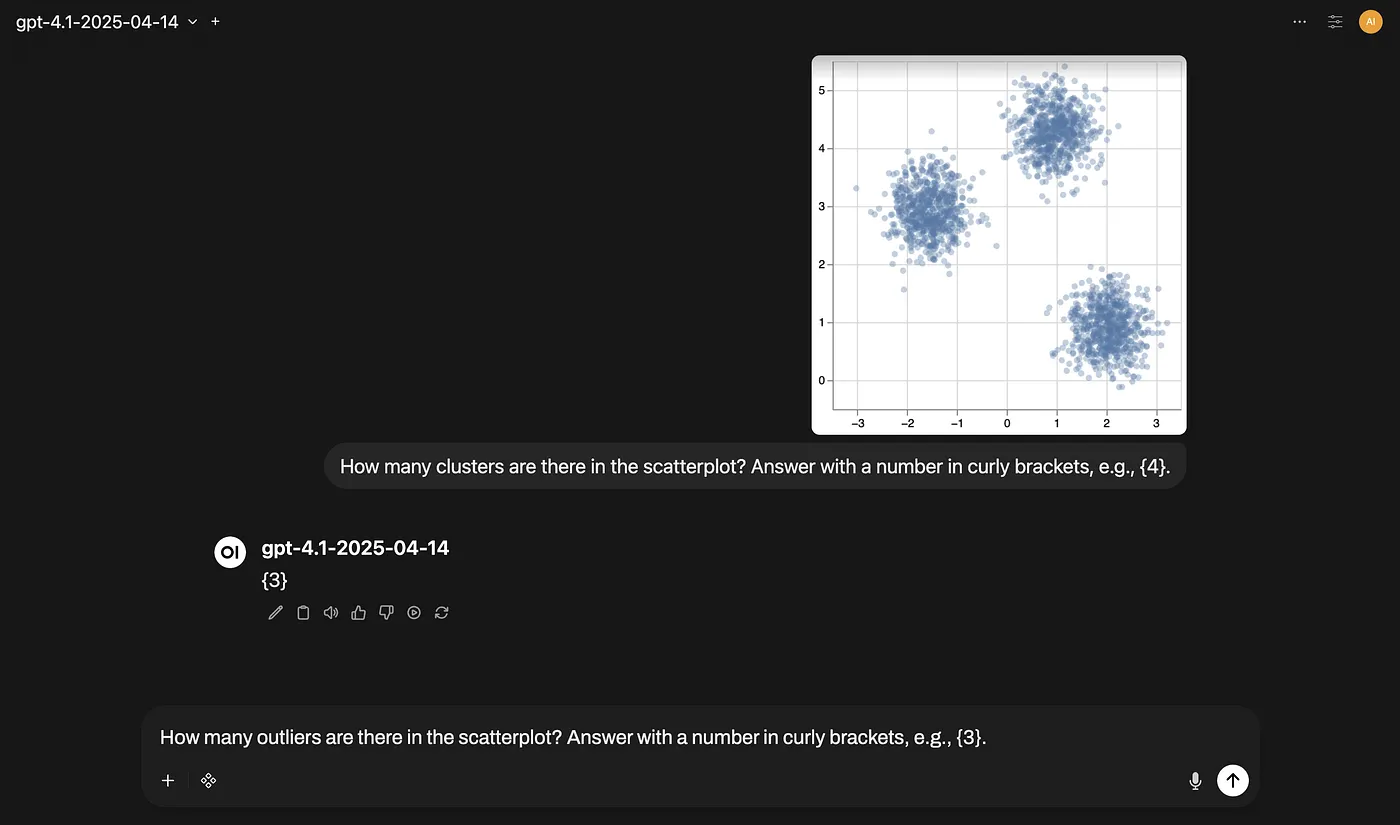
Benchmark It Yourself (BIY): Preparing a Dataset and Benchmarking AI Models for Scatterplot-Related Tasks
When we need to visualize and interact with millions, or even just thousands, of individual points while analyzing data, we typically resort to rendering them in the browser using a canvas.
João Palmeiro

Building Feedzai’s First Figma Charting Library: A Summer Experience
Find out more about the recent Figma Library of charts created to help Feedzai’s Data Visualization and UX teams in their mockups creation process.
Francisca Calisto
From a Trace to Money Flow: How we built an interactive visualization to uncover money laundering
Money laundering works by staying invisible. Feedzai's Money Flow visualization turns scattered transaction traces into a readable map of who moved money, where, and when.
Salomé Esteves
Benchmark It Yourself (BIY): Preparing a Dataset and Benchmarking AI Models for Scatterplot-Related Tasks
When we need to visualize and interact with millions, or even just thousands, of individual points while analyzing data, we typically resort to rendering them in the browser using a canvas.
João Palmeiro
Building Feedzai’s First Figma Charting Library: A Summer Experience
Find out more about the recent Figma Library of charts created to help Feedzai’s Data Visualization and UX teams in their mockups creation process.
Francisca Calisto
Page printed in 12 Oct 2026. Plase see https://research.feedzai.com/research_area/data-visualization for the latest version.