Publication
Show Me What’s Wrong!: Combining Charts and Text to Guide Data Analysis
Published at NLVIZ, a workshop at IEEE VIS 2024
Abstract
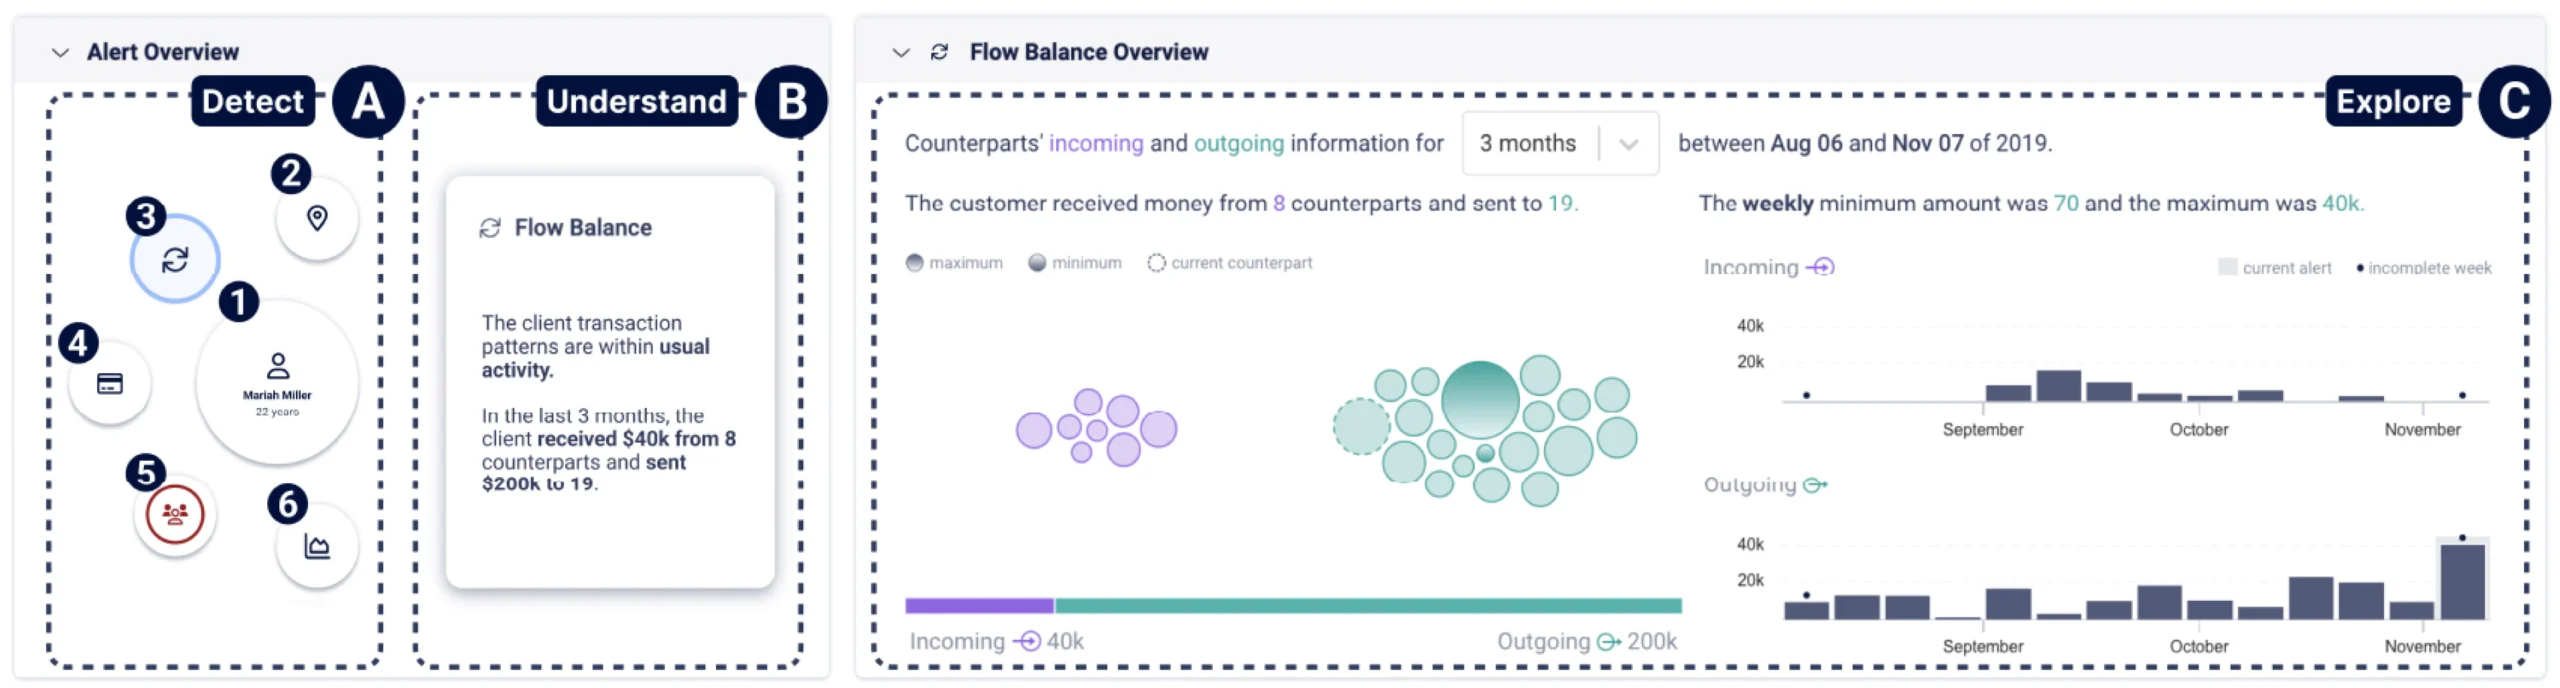
Analyzing and finding anomalies in multi-dimensional datasets is a cumbersome but vital task across different domains. In the context of financial fraud detection, analysts must quickly identify suspicious activity among transactional data. This is an iterative process made of complex exploratory tasks such as recognizing patterns, grouping, and comparing. To mitigate the information overload inherent to these steps, we present a tool combining automated information highlights, Large Language Model generated textual insights, and visual analytics, facilitating exploration at different levels of detail. We perform a segmentation of the data per analysis area and visually represent each one, making use of automated visual cues to signal which require more attention. Upon user selection of an area, our system provides textual and graphical summaries. The text, acting as a link between the high-level and detailed views of the chosen segment, allows for a quick understanding of relevant details. A thorough exploration of the data comprising the selection can be done through graphical representations. The feedback gathered in a study performed with seven domain experts suggests our tool effectively supports and guides exploratory analysis, easing the identification of suspicious information.